Visual statistics
I couldn't find anything about this via the search (although I may not have found the correct search terms), but has anyone suggested a more visual approach to the statistics of a car?
So, instead of like "Sportiness: 25", you get bar that runs from red to green, and fills up accordingly. Much like this:
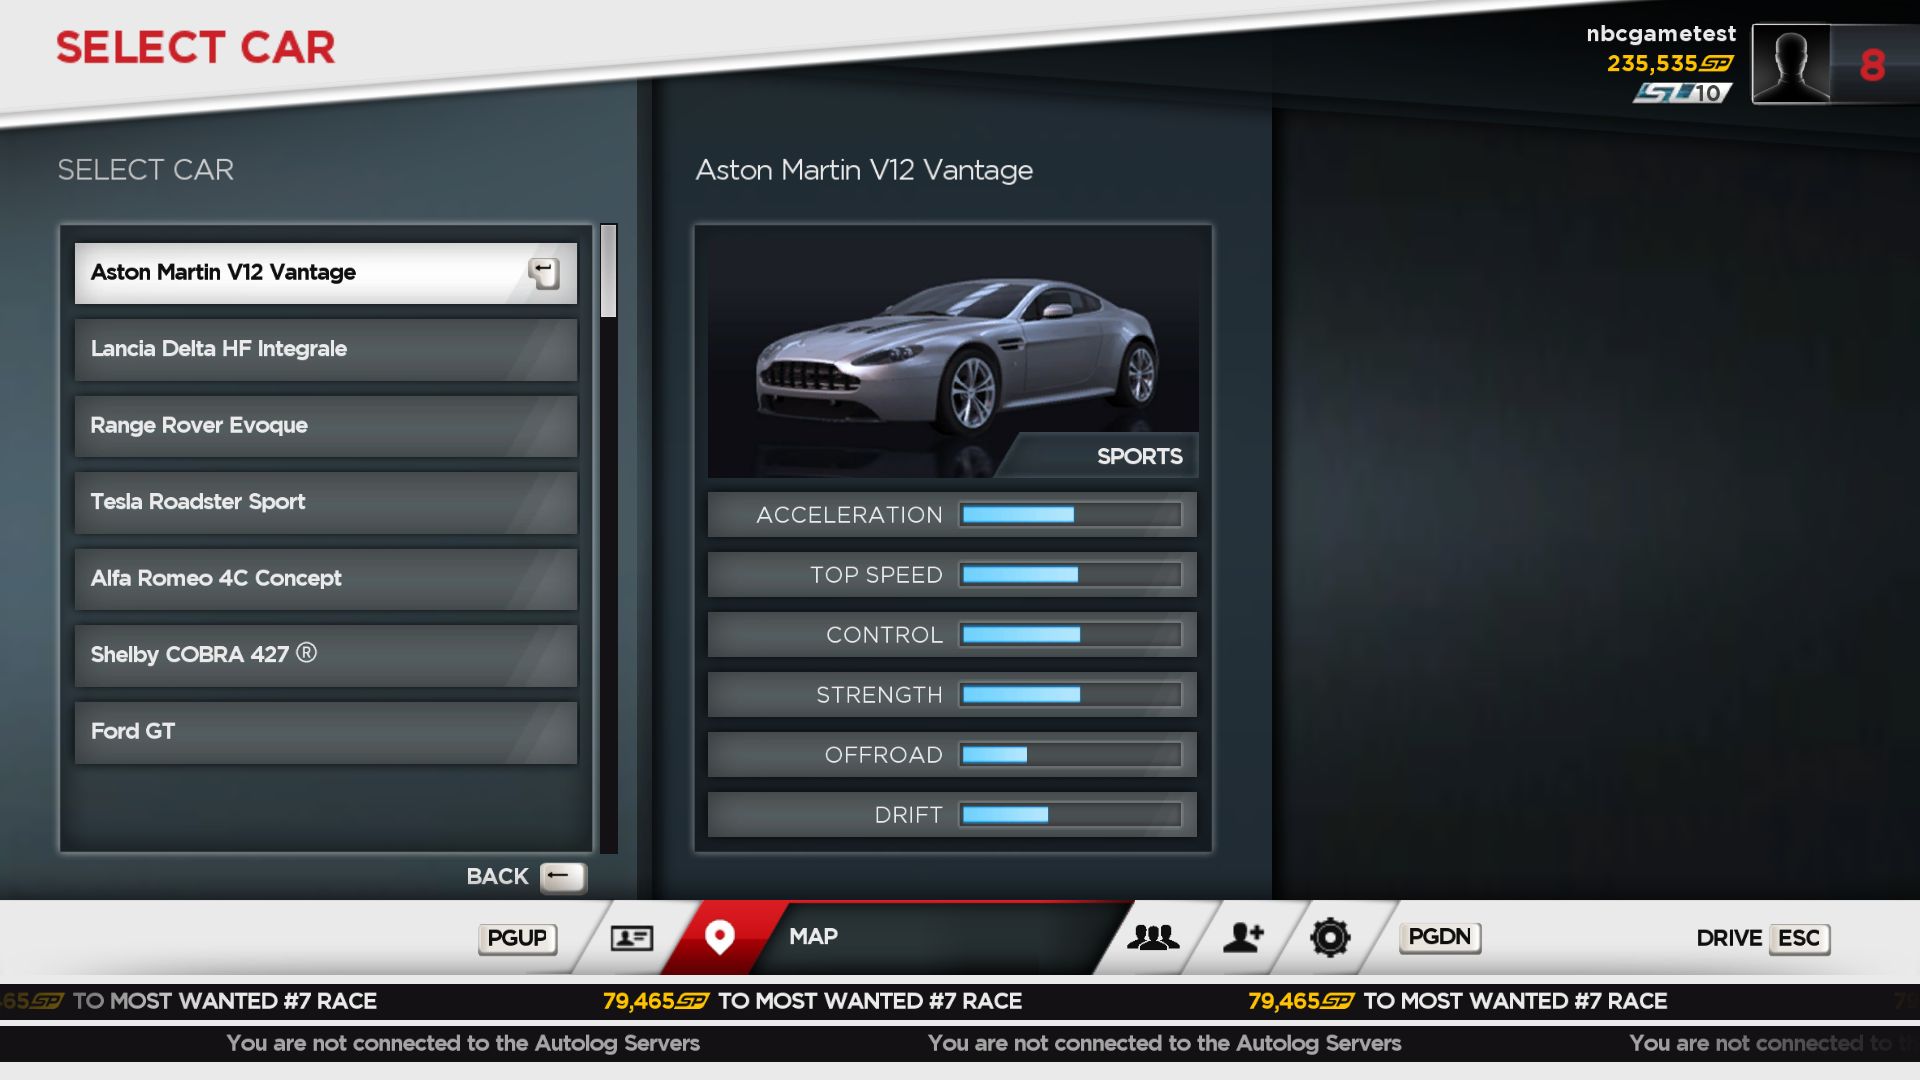
Someone surely must have suggested this already, no?
So, instead of like "Sportiness: 25", you get bar that runs from red to green, and fills up accordingly. Much like this:
Someone surely must have suggested this already, no?